Tags
Learn D3 in 5 days #
I recently subscribed to Ben Clinkinbeard's learn D3.js in 5 days, and am currently on day 3. I read through the first 2 days, and felt fairly comfortable with selecting elements, so I did not follow along on the first two days. I probably should have, but there are only so many hours in the day.
Why Learn D3
D3 is the ubiquitous dynamic visualization library for building custom interactive visualizations on the web. It is a bit low level, and more verbose than many other libraries that build upon it, but if you want full control D3 is the way to go. I have used a few libraries built upon d3 in the past and have been very happy with the results. For now I want to start learning a bit about how d3 works. I know that learning it is going to take a long time, so I want to start working on some simple examples now in order to build my understanding so that I can learn quickly when I am ready to dive in. If I never decide I need to take the deep dive into d3, I think understanding how it works will only help when I am using higher level libraries.
Final Result #
I cant express how fun it was to build this example. I always saw d3 as being super low level and that I could never build something in it. It was so cool to watch the magic happen in such a short period of time.

Prep #
Load D3
I am going to load d3 from the cloudflare cdn for simplicity
script src='https://cdnjs.cloudflare.com/ajax/libs/d3/4.13.0/d3.min.js'></script>
Base Styles
I will use this as by stylesheet throughout the examples.
<style> .chart { display: block; padding: 10px; background: peachpuff; } .bar { height: 30px; margin: 5px; background: teal; } button { background: rgb(240, 196, 211); border: none; font-size: 1.3rem; border-radius: 5px; padding: 0.2rem 1rem; margin-bottom: 1rem; } .on { background: palevioletred; } </style>
Example one #
This one is a bit cheaty in that it has the exact number of divs already rendered for us, but it is a good learning point so see how to map data to attributes
By the way this is the first chart that I have ever created with d3, and this silly thing is so exciting!!
Markup
<div id="chart1" class='chart'> <div></div> <div></div> <div></div> <div></div> <div></div> </div>
JavaScript
const data = [90, 270, 152, 42, 83] d3.select('#chart1') .selectAll('div') .data(data) .attr('class', 'bar') .style('width', function (d) { return d + 'px' })
Result

example 1 plot
Example 2 #
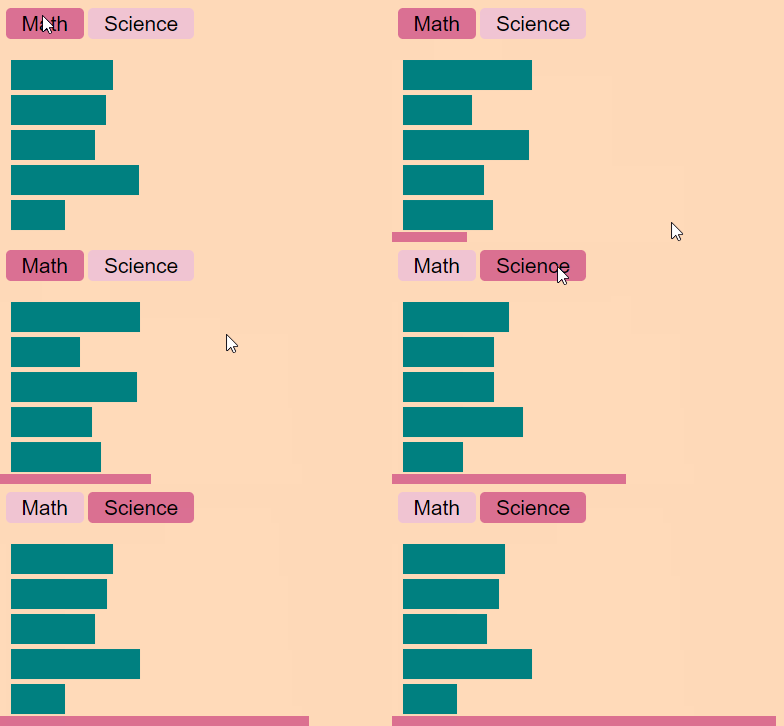
This time we are going to get a bit more dynamic. The divs will be generated on the fly and will update with the press of a button.
Markup
<div id="chart2" class='chart'> <button class='math' onclick="render('math')">Math</button> <button class='science' onclick="render('science')">Science</button> </div>
JavaScript
const data2 = [ { name: 'Alice', math: 93, science: 84}, { name: 'Bob', math: 73, science: 82}, { name: 'James', math: 92, science: 78}, { name: 'Steve', math: 77, science: 93}, { name: 'Jordan', math: 80, science: 68}, ] function render(subject) { d3.select('#chart2') .selectAll('button') .classed('on', false) d3.select('.' + subject) .attr('class', subject + ' on') d3.select('#chart2') .selectAll('div') .remove() d3.select('#chart2') .selectAll('div') .data(data2) .enter() .append('div') .attr('class', 'bar') .style('width', function(d) { return (d[subject]-50)*3 + 'px' }) } render('math')
Result

example 2 working buttons
Example 3 #
In Example2 the chart jumped from one state to the next with a complete wipe and redraw in betweeen. In this example we will retain the same bars and only update their width. This will allow us to transition/animate them.
Markup
<div id="chart3" class="chart"> <button class="math" onclick="render3('math')">Math</button> <button class="science" onclick="render3('science')">Science</button> </div>
JavaScript
const data3 = [ { name: 'Alice', math: 93, science: 84 }, { name: 'Bob', math: 73, science: 82 }, { name: 'James', math: 92, science: 78 }, { name: 'Steve', math: 77, science: 93 }, { name: 'Jordan', math: 80, science: 68 }, ] function render3(subject) { d3.select('#chart3') .selectAll('button') .classed('on', false) d3.select('#chart3') .select('.' + subject) .attr('class', subject + ' on') const bars = d3.select('#chart3') .selectAll('div') .data(data3, function(d) { return d.name }) const newBars = bars.enter() .append('div') .attr('class', 'bar') .style('width', 0) newBars.merge(bars) .transition() .style('width', function(d) { return (d[subject]-50)*3 + 'px' }) } render3('math')

example 3 nice and smooth
Final Thoughts #
I express how fun this was. I have always viewed d3 as something so low level I would never be able to touch. The tutorial was super fun and very approachable. Any other resources that I have seen to start learning d3 appear to be very time consuming before you start writing code and digging into it yourself. These examples were great, I was able to get started creating visualizations in no more than 5 minutes of reading. Now that I feel like I have a shallow understanding of how it works I feel better prepared to dive in.
