Tags
Learn D3 in 5 days
For what we are creating in these posts d3 is way overkill and very verbose, but I need to start somewhere! These are just stepping stones into real custom visualizations that cannot be done in any other tool today. I still cannot explain how excited I am to say "I created that in d3!!!"
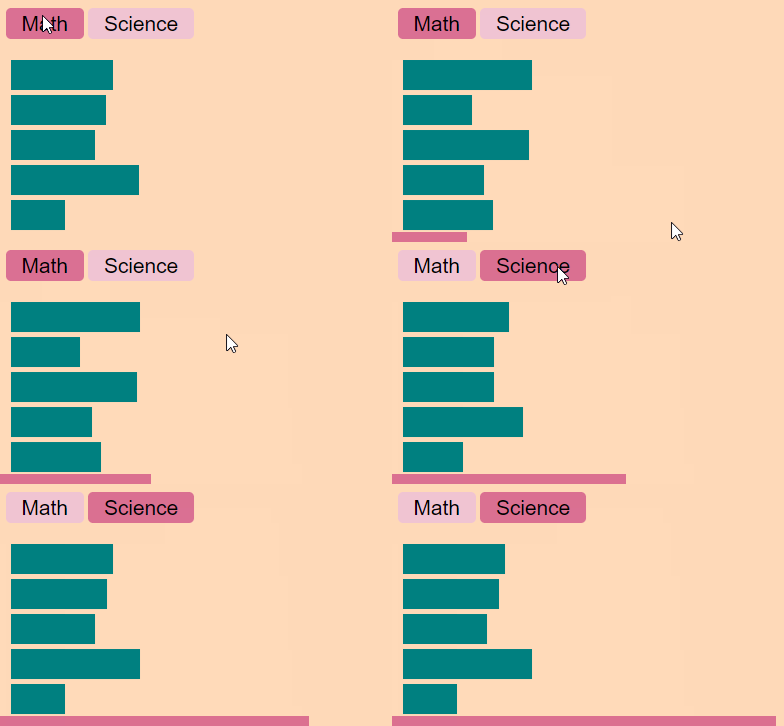
Todays Result
Today I will be learning about d3 scales, and adding them to the bar chart that we created yesterday. Follow along as I try to create something interesting.

Recall Example 3 from yesterday
maybe a few days ago.... give me a break I have a lot of other priorities
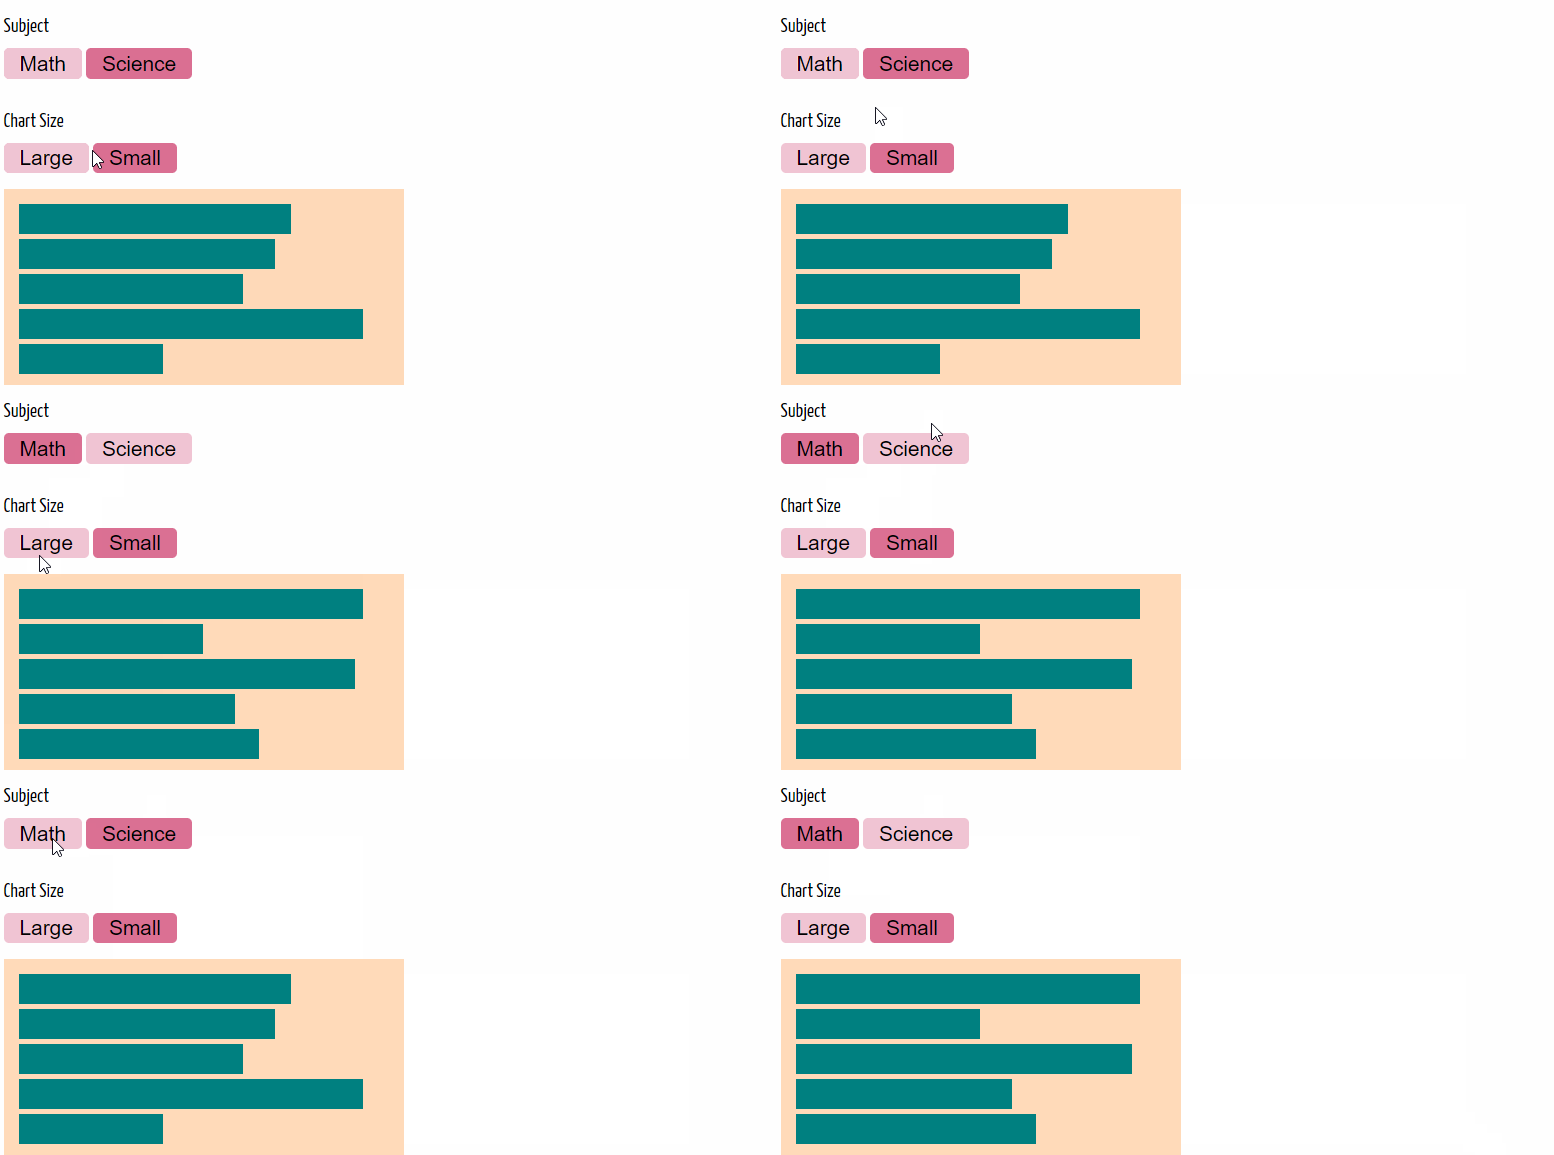
In yesterdays post we created a working example of a horizontal bar chart that shows grades for a set of 5 students that are all in two classes; 'Math' and 'Science'. The chart is interactive, and will switch subjects at the press of a button.

