Tags
Learn D3 in 5 days #
For what we are creating in these posts d3 is way overkill and very verbose, but I need to start somewhere! These are just stepping stones into real custom visualizations that cannot be done in any other tool today. I still cannot explain how excited I am to say "I created that in d3!!!"
Todays Result
Today I will be learning about d3 scales, and adding them to the bar chart that we created yesterday. Follow along as I try to create something interesting.

Recall Example 3 from yesterday #
maybe a few days ago.... give me a break I have a lot of other priorities
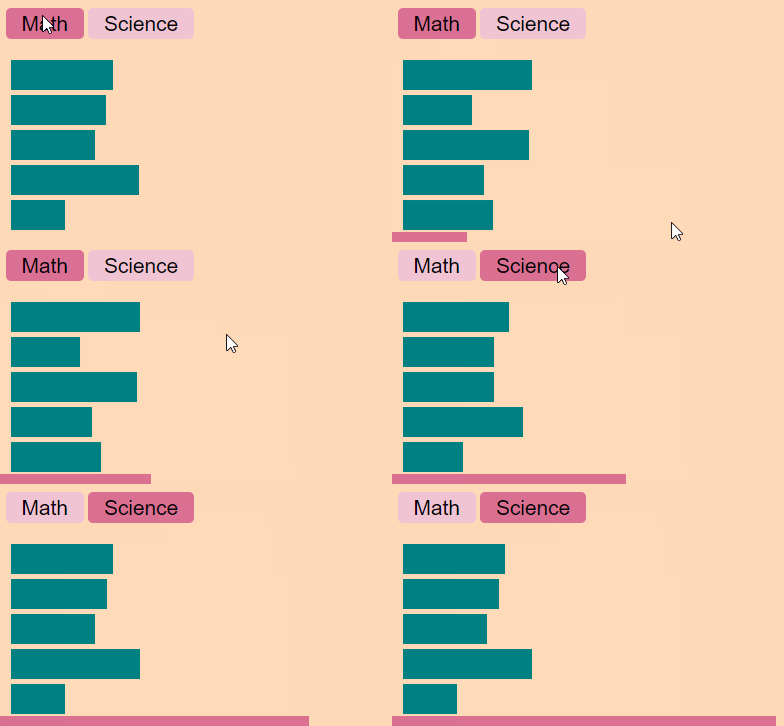
In yesterdays post we created a working example of a horizontal bar chart that shows grades for a set of 5 students that are all in two classes; 'Math' and 'Science'. The chart is interactive, and will switch subjects at the press of a button.

Add Scales #
One issue with that plot was that the scale was created by hand. In todays example we will let d3 take care of the scale for us. We will define a linear scale with an input range and an output range.
let xScale = d3.scaleLinear() .domain([50, 100]) .range([0, width()]);
Then we will change the following .style method call from return (d[subject]-50 * 3) + 'px' to return xScale(d[subject]) = 'px'.
newBars.merge(bars) .transition() .style('width', function(d) { return xScale(d[subject]) + 'px' }) .style('height', barHeight())
Keeping it dry
Note that if we had many different elements using the same scale with this code it would only exist in one place xScale and not separately in each style function. This makes our viz much more maintainable as we may see a need to change the scales in the future.
Adding Some Flair
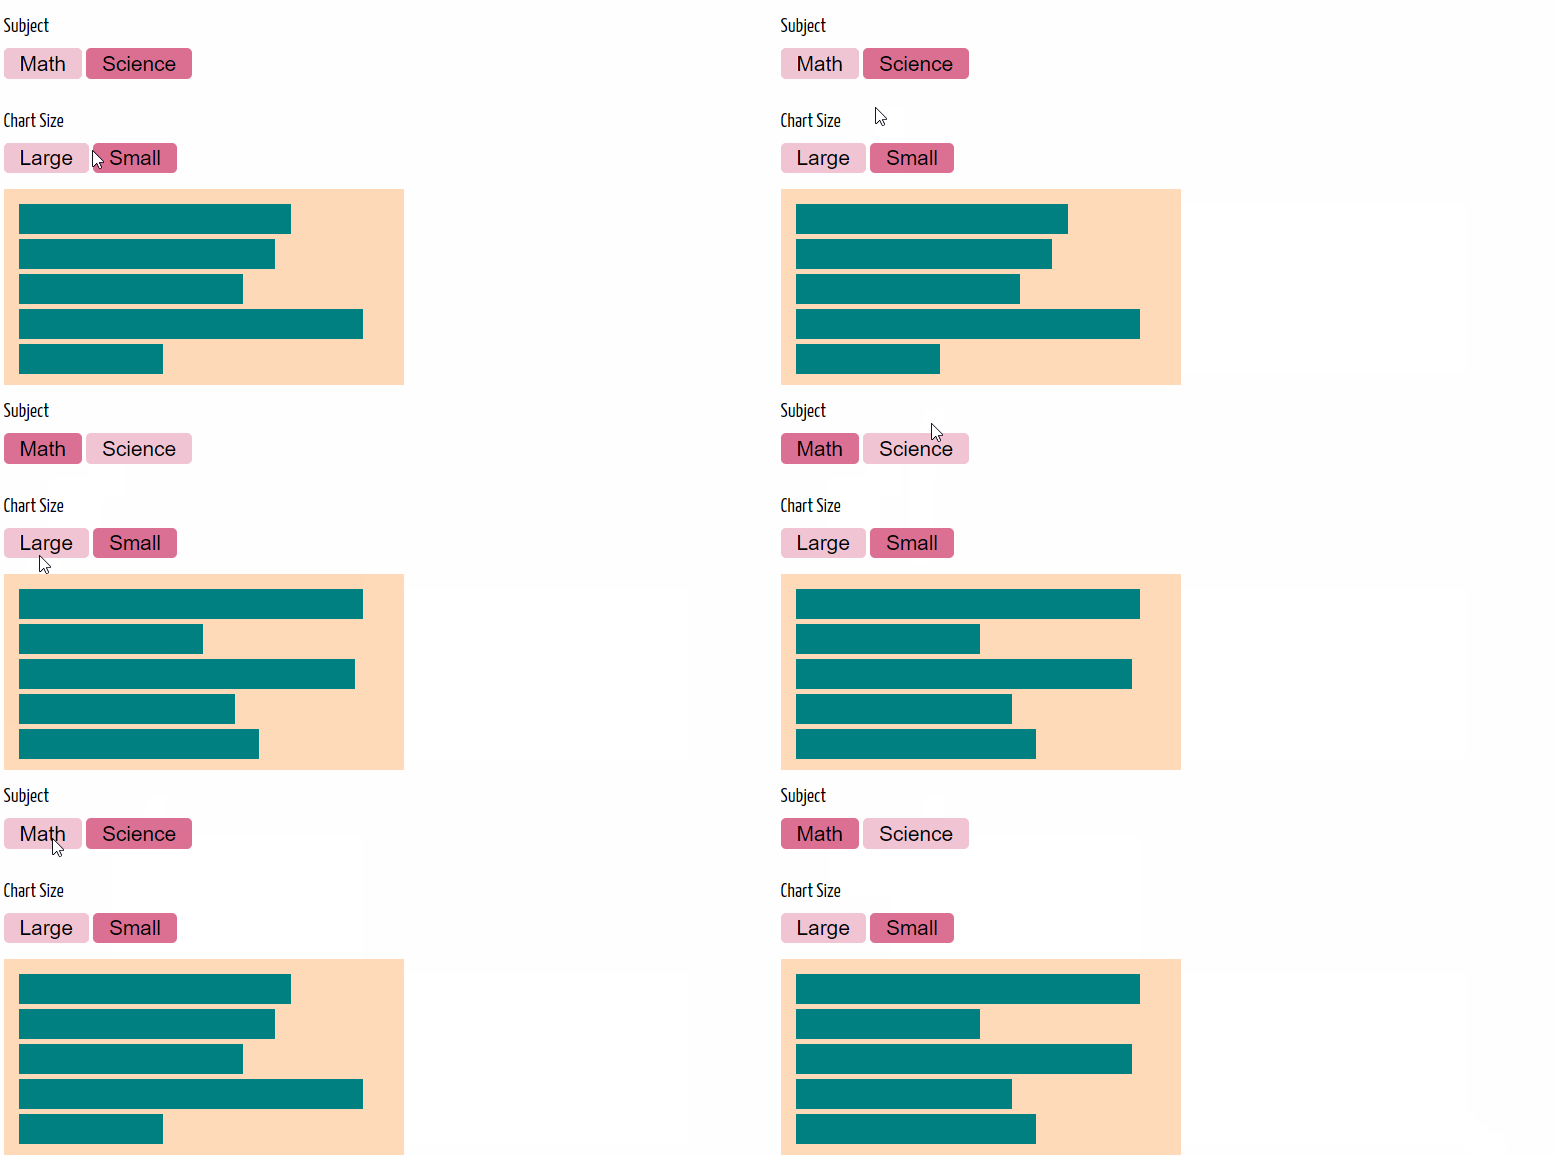
To give this viz some simple flair, and a reason that we might want to use scales. I added a new set of buttons to allow us to change the chart size and see the viz respond. Check out the markup in the Final Markup section if your interested in that. I do want to point out that I used the d3 selectors to add the chart size classes to the chart.
The select api is very jQuery inspired, but the method chaining syntax feels very natural to me as my main data tools is pandas. The d3 methods feel very much like method chaining in python. In fact, besides the way the function is defined it reads very much like python. This feels very comfortable to me as I am always loosing track of braces and semicolons when writing javascript!
function chart4_size(size) { d3.select('#sizes') .selectAll('button') .classed('on', false) d3.select('#sizes') .select('.chart4-' + size + '-btn') .classed('on', true) d3.select('#chart4') .attr('class', 'chart ' + size) subject = document .getElementById('subjects') .querySelector('.on') .classList[0] render4(subject) }
This is the css that we are using to change the size of our chart figure. Nothing fancy, just make full width or half width to show the responsiveness of our chart.
.big { width: 100% } .small { width: 50% }
Final Result #

Final Markup
Most of the markup here is for the buttons and the callbacks. This is not really the focus of today's exercise. I have included the html here so that you can see how the buttons are tied in to the Final Script.
<div id='buttons'> <h3>Subject</h3> <div id='subjects'> <button class='math' onclick="render4('math')">Math</button> <button class='science' onclick="render4('science')">Science</button> </div> <h3>Chart Size</h3> <div id='sizes'> <button class='chart4-big-btn' onclick='chart4_size("big")')>Large</button> <button class='chart4-small-btn' onclick='chart4_size("small")'>Small</button> </div> </div> <div id="chart4" class='chart'></div>
Final Style
#content{ max-width: 800px; margin: 0 auto; } .chart { display: block; padding: 10px; background: peachpuff; /* transition: all 500ms */ } .bar { height: 30px; margin: 5px; background: teal; } .bar:hover{ background: #444; } button { background: rgb(240, 196, 211); border: none; font-size: 1.3rem; border-radius: 5px; padding: .2rem 1rem; margin-bottom: 1rem } .on { background: palevioletred; } .big { width: 100% } .small { width: 50% }
Final script
Here is the final script so that you showing everything put together. Yes this is a lot of code for a bar chart without scales, click events, titles, tooltips, or anything fancy, but I need to start somewhere. d3.js is the language that builds fully custom vizualizations like no other tool today, and by doing a bit of practice now I will be ready for some serious stuff in the future.
// Setup the data const data4 = [ { name: 'Alice', math: 93, science: 84}, { name: 'Bob', math: 73, science: 82 }, { name: 'James', math: 92, science: 78}, { name: 'Steve', math: 77, science: 93 }, { name: 'Jordan', math: 80, science: 68 }, ] // Create some vanilla js functions to get the size of the chart chart4 = document.getElementById('chart4') let width = function() { return chart4.getBoundingClientRect().width } let height = function() { return chart4.getBoundingClientRect().height } let barHeight = function() { height() / data4.length + 'px' } // create a function to update the size of the chart // Size is updated by adding a css class big or small // Note: the render function is called at the end to ensure the scale is re-rendered function chart4_size(size) { d3.select('#sizes') .selectAll('button') .classed('on', false) d3.select('#sizes') .select('.chart4-' + size + '-btn') .classed('on', true) d3.select('#chart4') .attr('class', 'chart ' + size) subject = document .getElementById('subjects') .querySelector('.on') .classList[0] render4(subject) } // render the plot // Note: I did need to bring the xScale and the width() call into the render // function to ensure that the scale was updated each time function render4(subject) { d3.select('#subjects') .selectAll('button') .classed('on', false); d3.seect('#subjects') .select('.' + subject) .attr('class', subject + ' on'); let xScale = d3.scaleLinear() .domain([0, 100]) .range([50, width()]); const bars = d3.select('#chart4') .selectAll('div') .data(data4, function(d) { return d.name }) const newBars = bars.enter() .append('div') .attr('class', 'bar') .style('width', 0) newBars.merge(bars) .transition() .style('width', function(d) { return xScale(d[subject]) + 'px' }) .style('height', barHeight()) } // create initial render and size render4('math') chart4_size('big')
