Kubernetes Monitoring Helm tutorial | Grafana Loki documentation
Grafana Labs · grafana.com [1]
This is a really great guide to setting up kubernetes monitoring with helm, it uses loki as a log datasource and alloy as a collector of kubernetes logs, events, and nodes. The charts are setup really well to start collecting logs from all your kubernetes pods.
References:
[1]: https://grafana.com/docs/loki/latest/send-data/k8s-monitoring-helm/
Posts tagged: grafana
All posts with the tag "grafana"
3 posts
latest post 2025-05-07
Configure the Tempo data source | Grafana documentation
Grafana Labs · grafana.com [1]
Really helpful article to getting tempo datasource setup in grafana, this enables you to see span and trace data within grafana. This data helps debug and work through issues that you might come into with performance and need to see the timing of requests along with logs.
References:
[1]: https://grafana.com/docs/grafana/latest/datasources/tempo/configure-tempo-data-source/
I’m trying to learn proper logs, monitoring, otel, and grafana. Today I imported a bunch of pre-made k8s dashboards and made a few of my own for specific apps, and it made me want to know how I can turn my own custom dashboards into infrastructure as code. Turns out grafana makes it pretty easy to do this, if you have the grafana dashboard sidecar running. It will pick up any ConfigMap with the grafana_dashboard label and import it.
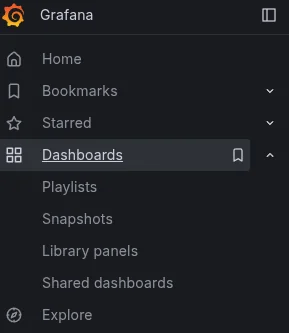
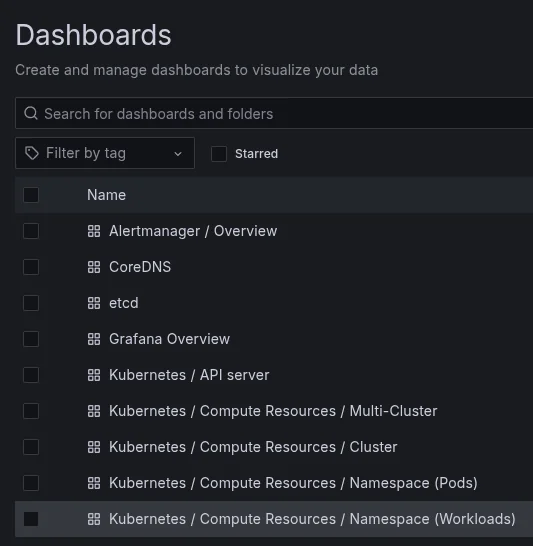
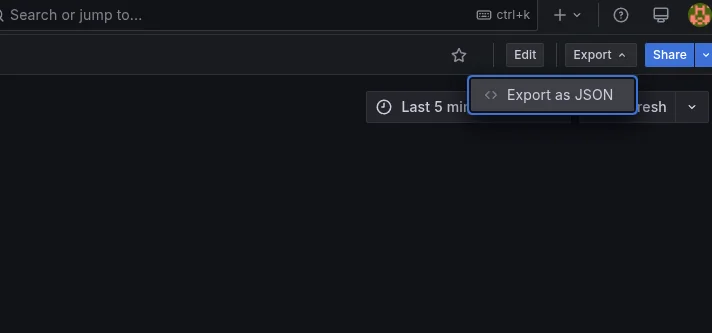
Go to Dashboards -> Pick a Dashboard -> Export -> JSON.
apiVersion: v1
kind: ConfigMap
metadata:
  name: my-dashboard
  namespace: meta
  labels:
    grafana_dashboard: "1"
data:
  my-dashboard.json: |
    {
      "annotations": {
        "list": [
      ...
      "uid": "fel2uhjhepg5ce",
      "version": 3
    }